| |
응용 분야
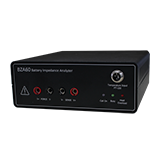
The BZA60 Battery Impedance Analyzer, which covers a broad range of battery test functions ranging
from DC voltage (up to 60V) and impedance test (500uΩ ~50Ω), is an ideal test tool for performance
testing of single cell, battery pack ,individual stationary batteries under 60Volt.
The BZA60 is designed to measure battery impedance, dc and ac voltage, ac current, frequency and battery
temperature. The BZA60 can obtain a Nyquist plot & Bode plot by measuring the impedance of the battery.
This makes it easy to see changes in the Rs and Rct values that correlate to the battery's state of health(SoH)
and state of charge(SoC),allowing user to evaluate battery performance.
EIS data from BZA60 can be analyzed with ZMAN impedance analysis software by automatic model searching and automatic
fitting. Proper model library for user’s batteries can be grouped to minimize the analysis time.
Application
-
Impedance measurement of energy device ;
battery , fuel cell
Features
-
Real time plot with monitoring channel status following
technique
-
Open circuit voltage measurement, battery temperature measurement possible using optional PT100 sensor.
-
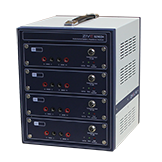
Multichannel operation is available with different models in network
-
Independent impedance data analysis with modeling & fitting, ZMAN™ software compatible data format
(No license requirement)
-
Fine setting is available by subdividing the frequency to fix to 65535 per decade when fixed frequency experiments.
Software
-
Independent examination from the PC is available after the test starts.
-
A various scope of parameters for the test is adjustable that are used in the test
-
Even if you lose connection of BZA and PC, if the device is powered on, the device will continue experiment . Memory can be saved after the connection recovers.
-
Data is saved in the form of binary format that is compatible with the ZMAN software thus can be transformed into the text(CSV, TXT).
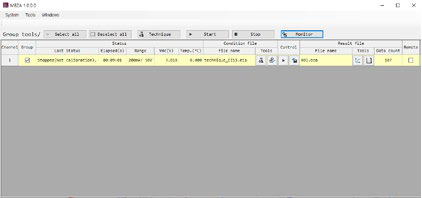
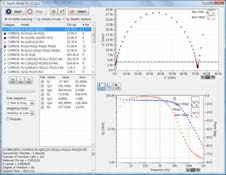
Control Screen
• Mutichannel operation under mixing
configuration with different model is available
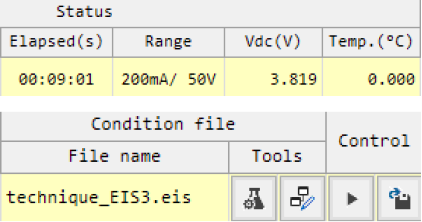
• Real-time monitoring of current/voltage range, measured voltage value,
and
measured temperature value regardless of a test is started. (data are not logged)
• Displaying schedule file and data file name
• Schedule file selection/modification
• Start/Stop operation
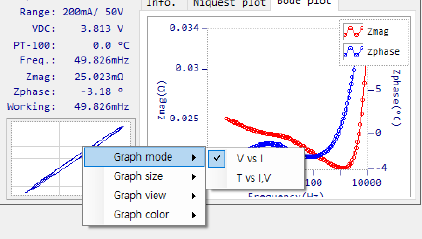
Real time plot and data monitoring
• Lissajous plot/ current, voltage vs. time for AC waveform
• Galvanostatic EIS (Quick galvanostatic EIS)
- Nyquist plot / Bode Plot
• Rs-psuedo Rp/ HFR both
- Cs, Cp vs time graph
• Zre, Vdc vs time graph (HFR)
• Rs-psuedo Rp vs time graph (Rs-psuedo Rp measurement)
• Vdc, Temperature vs time graph (Discharge test)
• Eoc, Temperature vs time graph (Eoc_temp monitor)
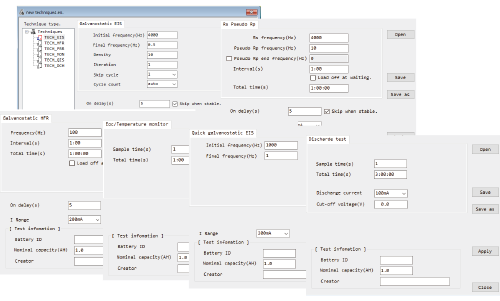
Technique selection & Parameter Input Box
• Galvanostatic Electrochemical Impedance Spectroscopy
- Bias & amplitude value is determined by current range setting
- Parameters: Frequency range, data density, iteration
• Rs-psuedo Rp measurement
- Rs frequency, psuedo Rp frequency setting
- Interval & Total time setting
• High frequency resistance measurement(HFR)
- HFR frequency setting
- Interval & Total time setting
• Eoc - Temperature monitor
• Quick galvanostatic EIS for screening
• Constant current Discharge test
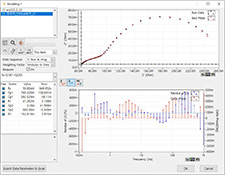
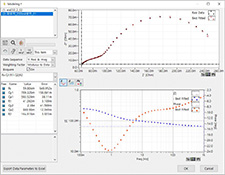
Fitting display LEVM fitting
 Automatic Model Searching
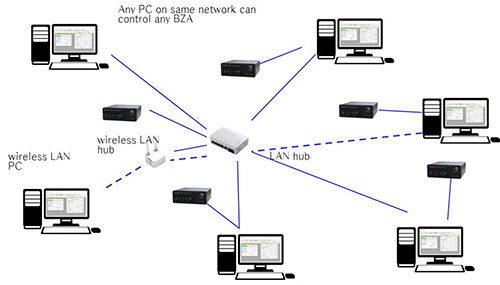
Network configuration(Wired,Wireless)
|